QUICK ANSWER
What to Know First
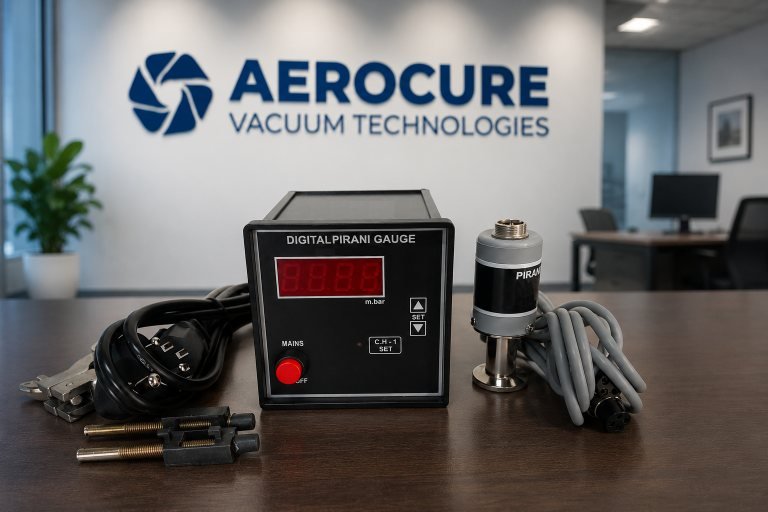
The control circuit heats a filament or sensing element and monitors the electrical power or resistance associated with holding it at a defined condition. Gas molecules carry heat away. Within the sensor’s useful region, the resulting heat loss changes with gas density, and the electronics convert that response into an indicated pressure for a reference gas.
OVERVIEW
The Technical Context
A Pirani gauge does not sense pressure force directly. It observes heat transfer from an electrically heated element to its surroundings. The gas contribution is separated as far as the sensor design allows from heat conducted through supports and heat transferred by radiation or other paths.
The electronics map the sensor response to pressure using a stored characteristic. Because different gases carry heat differently, the indicated pressure normally assumes a reference gas unless the exact gauge provides a documented gas correction or selectable curve.
- Indirect measurement based on gas thermal conductivity
- Reading depends on gas species and sensor calibration
- Useful response exists only within model-specific limits
- Contamination and temperature can change behaviour
01 — PRINCIPLE
Pressure Is Inferred from Heat Loss
A thin wire or micro-machined element is electrically heated above its surroundings. Gas molecules collide with the element and transport energy toward the sensor body. As gas density changes, the gas-related heat transfer changes within a useful part of the vacuum range.
A bridge or feedback circuit detects the resulting resistance, temperature or power change. The instrument electronics linearise that response and output an indicated pressure. The exact circuit and control strategy vary by sensor design.
02 — PARTS
What Is Inside the Measurement Chain
- A heated filament or thermal sensing element exposed to the process gas
- Supports and a sensor body that provide additional heat-transfer paths
- A temperature-sensitive electrical element or resistance bridge
- Control and signal-conditioning electronics
- A controller, display or system interface where required
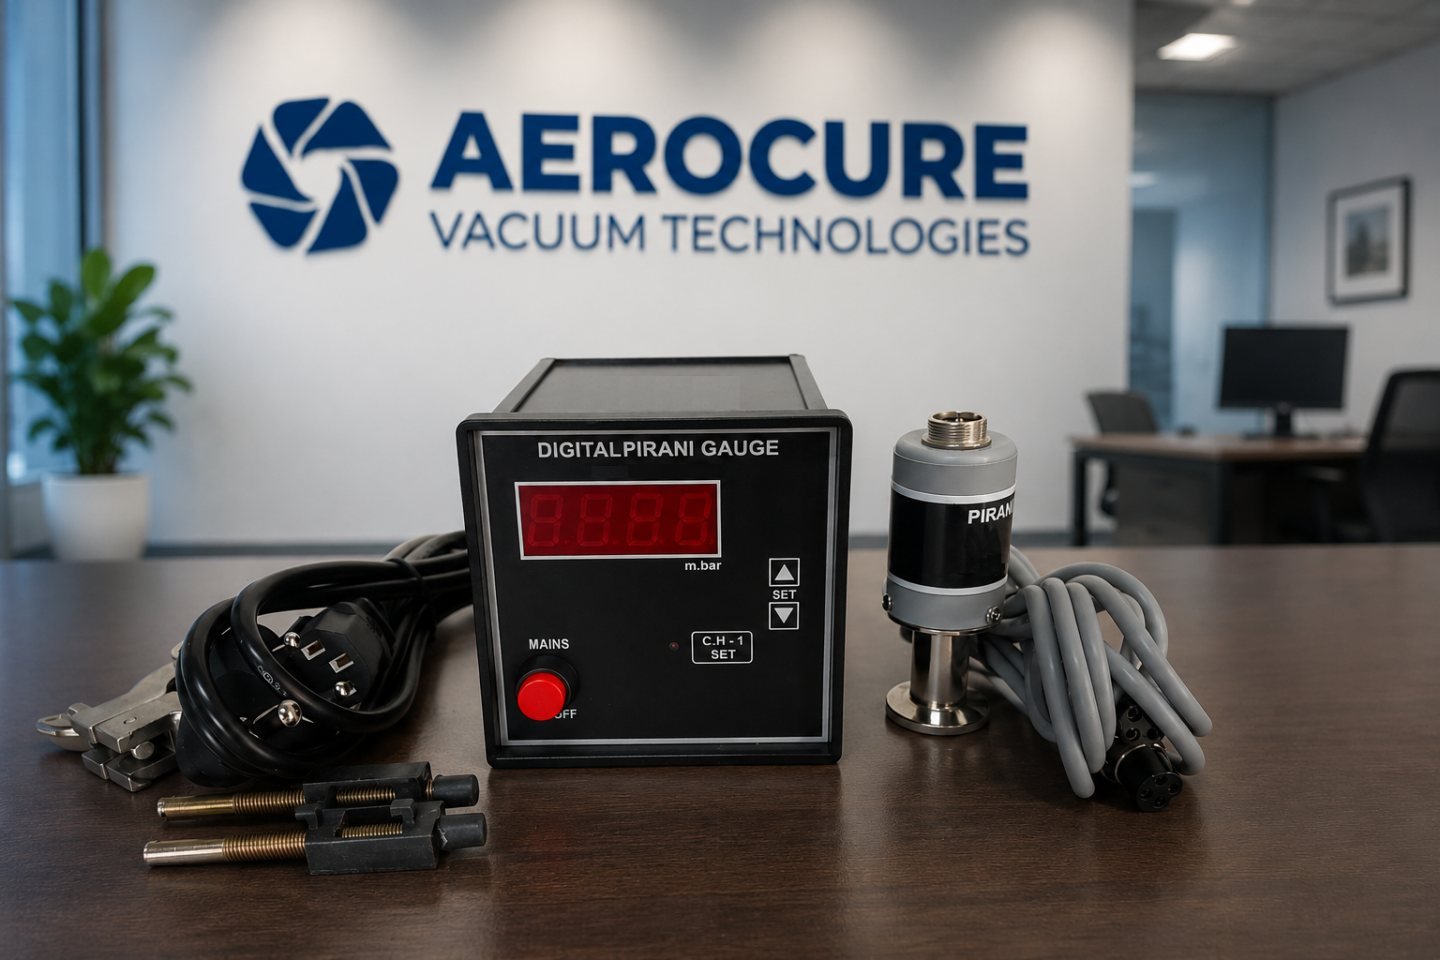
Technical note: The sensor head, electronics, cable and controller form a measurement chain. Compatibility and scaling must be confirmed for the exact combination.
03 — RESPONSE CHAIN
From Gas Density to an Indicated Pressure
- 01 The element is heatedElectrical input establishes the operating condition defined by the sensor design.
- 02 Heat follows several pathsEnergy leaves through the gas, supports and radiation; only part of the total is pressure dependent.
- 03 Gas heat transfer changesWithin the useful region, changing molecular density changes the heat carried from the element.
- 04 Electronics measure the responseA bridge or feedback circuit converts the thermal change into an electrical signal.
- 05 A pressure curve is appliedThe signal is mapped to an indicated pressure for the configured reference gas and instrument.
04 — GAS DEPENDENCE
Why Gas Type Changes the Reading
Gases differ in molecular mass and thermal transport behaviour. Two gases at the same true pressure can therefore remove different amounts of heat and produce different Pirani indications. Many instruments are characterised for nitrogen or air.
For another gas, use only the correction, gas curve or configuration documented for the exact gauge. Mixtures and changing process compositions can make a single correction inadequate, especially when composition is not known.
05 — LIMITS
Why the Useful Range Has Upper and Lower Boundaries
At higher pressures, gas heat transfer can become less sensitive to pressure and convection or other effects may contribute. At lower pressures, heat conducted through supports and thermal radiation can dominate the shrinking gas contribution. The response therefore flattens outside the useful region.
Do not transfer the range of one Pirani design to another. Filament geometry, temperature, electronics, calibration and combination-sensor logic all influence the stated range and accuracy.
06 — INFLUENCES
Conditions That Can Affect the Indication
- Gas species, mixture and changing process composition
- Deposits, oil, dust, moisture or reaction products on the sensing element
- Ambient and process temperature or insufficient stabilisation
- Mounting orientation, vibration and conductance to the measurement point
- Incorrect controller, cable, scaling, supply or gas setting
07 — COMPARISON
Pirani Compared with Other Gauge Approaches
| Approach | Gas dependence | Typical role | Key limitation to check |
|---|---|---|---|
| Pirani | Yes | Pump-down and routine vacuum indication | Process gas, contamination and model-specific response limits |
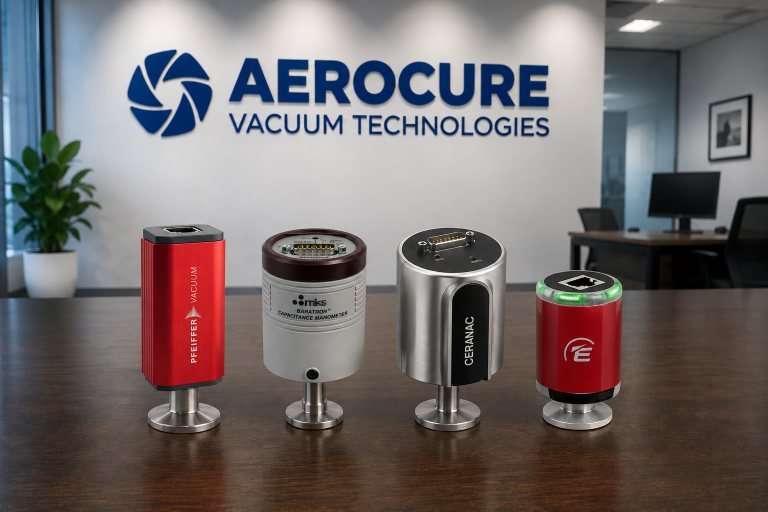
| Capacitance diaphragm | Generally gas independent | Process pressure measurement and control | Full-scale selection, overpressure, temperature and wetted materials |
| Pirani + ionisation combination | Yes for both sensing principles | A wider monitored pressure envelope | Transition logic and the limitations of each element |
| Ionisation gauge | Yes | High- and ultra-high-vacuum indication | Cleanliness, gas, filament or discharge behaviour and protection |
08 — CONDITION
Interpret Drift and Maintenance Needs Carefully
A changed reading may come from the vacuum system, gas composition, contamination, installation or the measurement chain. Compare operating conditions and an independent indication before treating the sensor as the only cause.
Follow the manufacturer’s instructions for inspection, adjustment, cleaning and replacement. Exposed thermal elements can be delicate, and an unsuitable cleaning method can damage the sensor or change its response.
Technical note: Calibration checks the instrument response under defined conditions. It does not prove that the same reading will remain accurate for every gas, location or contaminated process.
PRACTICAL WORKSHEET
Pirani Reading Interpretation Checklist
Before acting on an unexpected pressure value, review the measurement context and the wider vacuum system.
Instrument identity
- Exact sensor and controller model
- Configured gas or correction
- Output scaling and units
Operating condition
- Gas or mixture currently present
- Temperature and stabilisation time
- Valve, pump and vent state
Installation
- Port location and conductance
- Mounting orientation and cable
- Evidence of oil, moisture or deposits
Verification
- Comparison with trend or independent gauge
- Manufacturer diagnostic status
- Calibration, service and exposure history
PRIMARY REFERENCES
Technical Sources and Further Reading
These references support the general technical explanation. Always use the current instructions and approved procedure for the exact equipment and task.